
FIELD RESPONSE — WELL 42H
Surface Pressure Indications
Well 42H stage plots show immediate surface-pressure responses after documented PolyLoc placements. These are field observations, so each response should be read together with rate, slurry, proppant concentration, fluid system and HVFR changes shown on the source plots.
What the pressure response indicates
Temporary restriction
A pressure increase immediately after placement is consistent with material creating temporary resistance to the existing flow path.
Treatment redirection
The operational objective is to redirect treatment energy toward additional fracture pathways rather than repeatedly treating the same dominant path.
Real-time feedback
Surface pressure provides a field-visible indication that can be reviewed while pumping, but it should not be interpreted independently of the rest of the stage data.
FEATURED FIELD RESPONSE — WELL 42H, STAGE 20
Repeated response within a single stage
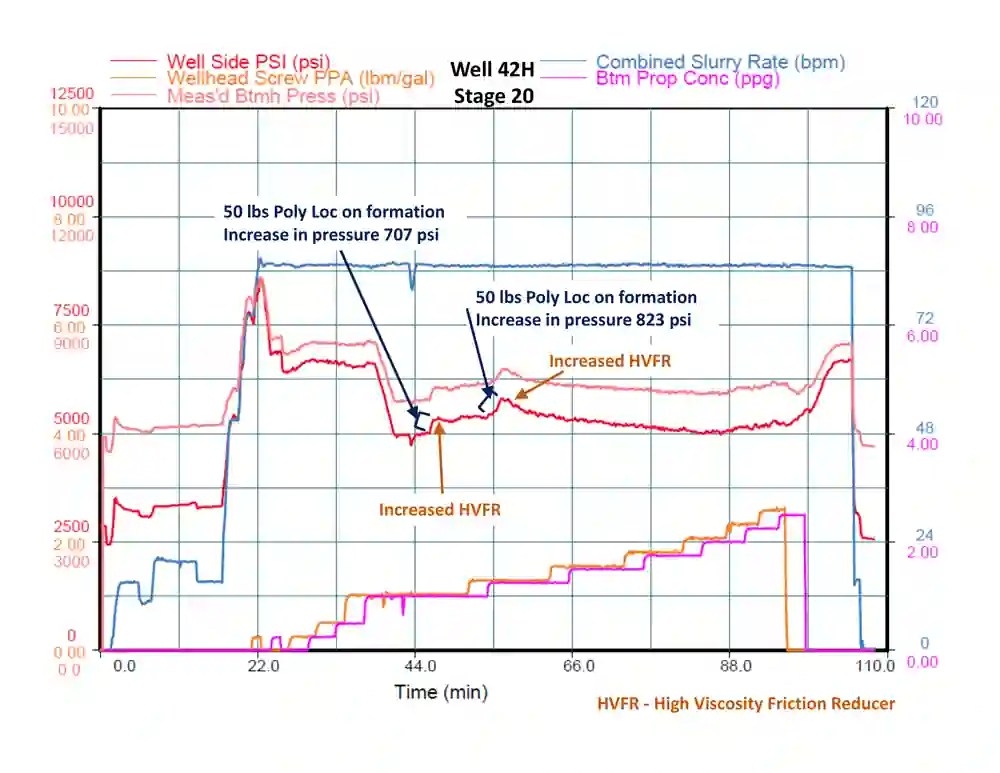
During Well 42H Stage 20, two separate 50-lb PolyLoc placements were followed by documented surface-pressure increases of +707 psi and +823 psi. The plot also identifies increased HVFR around the response intervals. The repeated pressure response within the same stage is consistent with restriction and treatment redirection. Field response should be evaluated together with rate, slurry, proppant concentration, fluid system and the original stage trace.
Selected stage responses to PolyLoc
| Stage | Injected (lb) | Pressure increase (psi) |
|---|---|---|
| 1 (Baseline) | None | — |
| 5 | 50 | 50 | 1,287 | 228 |
| 8 | 50 | 1,251 |
| 18 | 50 | 735 |
| 20 | 50 | 50 | 707 | 823 |
| 24 | 50 | 616 |
| 26 | 50 | 621 |
| 33 | 50 | 75 | 596 | 330 |
Baseline: Stage 1 is identified in the source set as a normal stage with no PolyLoc pumped.
Stage-by-stage pressure-response record
For readability, the table below focuses on the injected PolyLoc amount and the documented surface-pressure response. Multiple values within a stage represent separate placements.
| Stage | Injected (lb) | Pressure increase (psi) |
|---|---|---|
| 1 | None | — |
| 2 | 50 | 50 | 215 | 231 |
| 5 | 50 | 50 | 1,287 | 228 |
| 6 | 50 | 50 | 50 | 851 | 182 | 151 |
| 7 | 50 | 50 | 50 | 790 | 609 | 898 |
| 8 | 50 | 1,251 |
| 17 | 50 | 544 |
| 18 | 50 | 735 |
| 19 | 50 | 50 | 256 | 376 |
| 20 | 50 | 50 | 707 | 823 |
| 21 | 50 | 50 | 527 | 227 |
| 22 | 50 | 50 | 221 | 303 |
| 24 | 50 | 616 |
| 26 | 50 | 621 |
| 27 | 50 | 550 |
| 28 | 50 | 461 |
| 29 | 50 | 461 |
| 30 | 50 | 472 |
| 31 | 50 | 331 |
| 32 | 50 | 50 | 429 | 223 |
| 33 | 50 | 75 | 596 | 330 |
Source-plot context: the PolyLoc-treated stage plots annotate increased HVFR. These are field observations, not controlled isolation experiments; pressure response should be reviewed together with rate, slurry, proppant concentration, PPA, fluid system and the original stage traces.

