PolyLoc Frac Diverter logo — Maximizing Well Bore Potential

K&C DISTRIBUTION


PolyLoc

In-formation frac diverter

TESTING PHOTO RECORD

Testing Photos

Supporting still images are organized by test with consistent sizing and captions.

3D SLOT TEST

Slot Test Photos

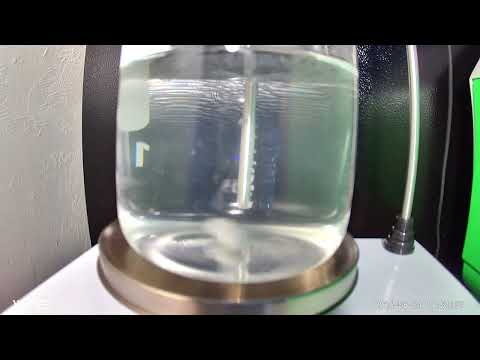
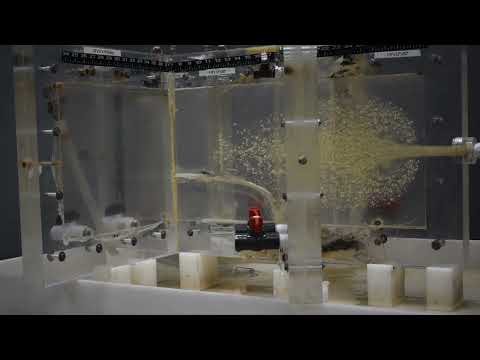
Video still from the PolyLoc 3D slot test
Slot-test video still
PolyLoc bridging / pack-off test through a 0.025-inch slot at 200 psi after 5 minutes in 20 cp guar. The test duration was 15 seconds and 86% of the fluid was retained.

POLYLOC 100°F

100°F Test Photos

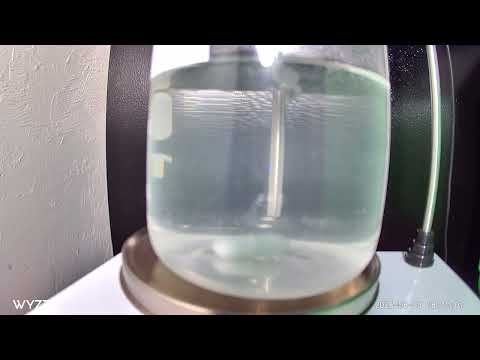
Video still from the PolyLoc 100 degree dissolution test
100°F test video still
Representative still from the 100°F time-lapse.

POLYLOC 120°F

120°F Test Photos

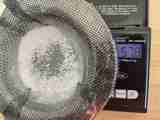
Starting PolyLoc sample and measurement setup for the 120°F dissolution test
Starting sample
Initial PolyLoc sample and measurement setup before the 120°F dissolution test.
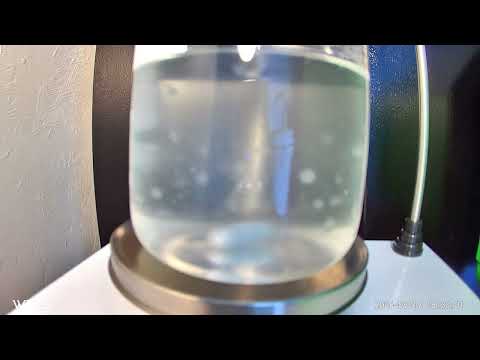
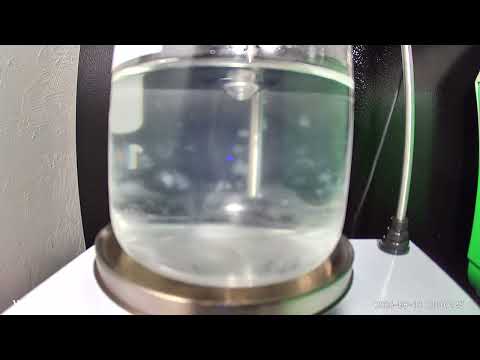
Video still from the PolyLoc 120°F dissolution test
120°F time-lapse still
Representative still from the 120°F dissolution test while the sample was in heated, moving fluid.
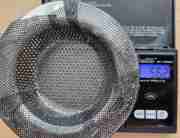
Final dry strainer weight check for the PolyLoc 120°F dissolution test
Final dry-weight check
No measurable dry residue was retained on the screen. The strained liquid was refrigerated over 24 hours and no re-solidification was observed.

POLYLOC 140°F

140°F Test Photos

Video still from the PolyLoc 140°F dissolution test
140°F test video still
Representative still from the 140°F time-lapse.

POLYLOC 160°F

160°F Test Photos

Video still from the PolyLoc 160°F dissolution test
160°F test video still
Representative still from the 160°F time-lapse.

LEADING COMPETITIVE PRODUCT 140°F

Comparison Test Photos

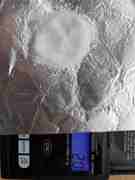
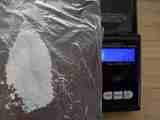
Initial leading competitive product sample on a scale
Initial sample
Starting comparison-product sample on the scale before the 140°F test.
Liquid observation from the leading competitive product 140°F comparison test
Liquid observation
Visual condition of the test liquid documented during the post-test review.
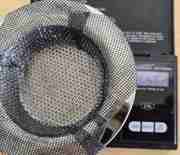
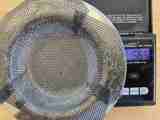
Leading competitive product post-test strainer on a scale
Post-test strainer
Material visible in the strainer after the 140°F comparison test.

POLYLOC 200°F

200°F Test Photos

2.0 g start • 4 hr 16 min • 0.0 g measurable dry residue • time-lapse approximately 1 frame every 9 seconds

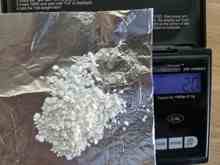
PolyLoc 200°F starting sample weighing 2.0 grams
Starting sample — 2.0 g
PolyLoc starting sample documented before the 200°F dissolution test.
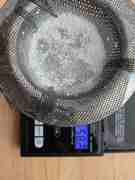
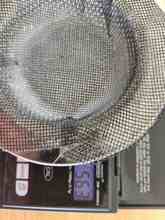
Initial dry strainer weight of 56.3 grams before the PolyLoc 200°F test
Initial dry strainer — 56.3 g
Dry strainer weight recorded before filtering the 200°F test liquid.
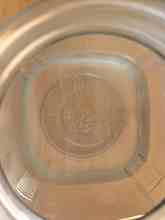
PolyLoc 200°F strained liquid after refrigeration
After refrigeration
No visible re-solidification was observed in the documented strained-liquid sample.
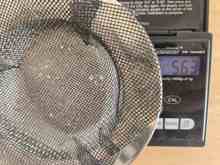
Final dry strainer after the PolyLoc 200°F test weighing 56.3 grams
Final dry strainer — 56.3 g
Final dry weight matched the 56.3 g initial strainer weight, yielding 0.0 g measurable dry residue.

Watch the PolyLoc 200°F time-lapse →

LEADING COMPETITIVE PRODUCT 200°F

200°F Comparison Test Photos

2.0 g start • approximately 24 hr 9 min • 1.3 g measurable retained material • time-lapse approximately 1 frame every 3 minutes

Leading competitive product 200°F starting sample weighing 2.0 grams
Starting sample — 2.0 g
Starting comparison-product sample documented before the 200°F test.
Initial dry strainer weight of 56.5 grams before the leading competitive product 200°F test
Initial dry strainer — 56.5 g
Dry strainer weight recorded before filtering the 200°F comparison-test liquid.
Leading competitive product 200°F strained liquid after refrigeration with visible material
After refrigeration
Visible material remained in the documented strained-liquid sample.
Final dry strainer after the leading competitive product 200°F test weighing 57.8 grams
Final dry strainer — 57.8 g
Final dry weight was 57.8 g versus 56.5 g initial, yielding 1.3 g measurable retained material.

Watch the Leading Competitive Product 200°F time-lapse →

NEXT STEP

Run a controlled 1–2 well field trial.

Match offset geology and completion design, capture exact PolyLoc timing and volume, document pressure and flowback observations, then compare normalized production over time.

K&C Distribution
405-853-0556
Chris.kcdistribution@gmail.com